



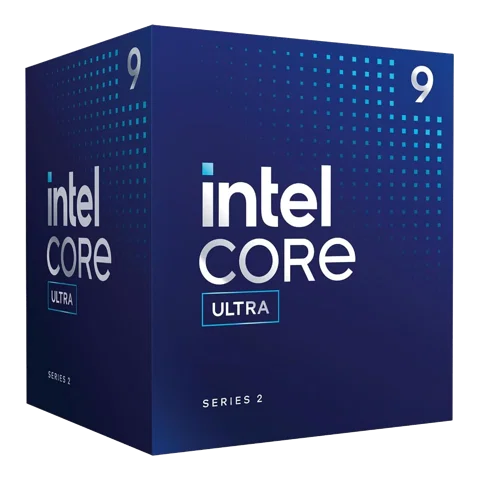
- Socket
- LGA1851
- Cores
- 24 (8P + 16E)
- Threads
- 24
- Frequency
- up to 5.6 GHz
- Cache
- 76 MB
- TDP
- 65 W
$611.06Approximate price
at Amazon
Price updated on 07/10/2026
Buy on Check today's price (opens in a new tab)
Pick two processors (or up to four) and see how they differ in specs, price and performance.
CPU 1
CPU 2
at Amazon
Price updated on 07/10/2026
Buy onCheck today's price (opens in a new tab)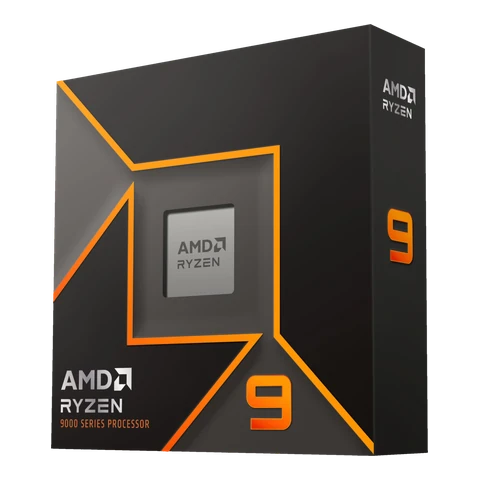
at Amazon
Price updated on 07/10/2026
Buy onCheck today's price (opens in a new tab)Note. Different sockets (LGA1851 and AM5): they are not interchangeable on the same motherboard. Switching from one to the other means changing the motherboard.
We highlight the best value in each row with a soft background. A higher or lower value does not mean the processor is better for you: it depends on how you use it.
| Specification | Core Ultra 9 285 | Ryzen 9 9900X |
|---|---|---|
| Price | ||
| Best price | ≈ $611.06 | ≈ $328.00 (best value in this row) |
| Performance per dollar (pts per USD) | Data not available | 0.21 |
| Processing | ||
| Cores | 24 (8P + 16E) (best value in this row) | 12 |
| Threads | 24 | 24 |
| Base frequency | 2.5 GHz | 4.4 GHz (best value in this row) |
| Boost / turbo frequency | 5.6 GHz | 5.6 GHz |
| L2 cache | 40 MB (best value in this row) | 12 MB |
| L3 cache | 36 MB | 64 MB (best value in this row) |
| L2 + L3 cache | 76 MB | 76 MB |
| Power and temperature | ||
| TDP / base power | 65 W (best value in this row) | 120 W |
| Maximum power (PPT / turbo) | 182 W | Data not available |
| Maximum temperature (Tjmax) | Data not available | Data not available |
| Platform | ||
| Socket | LGA1851 | AM5 |
| RAM | DDR5 | DDR5 |
| Official RAM speed | 6,400 MT/s (best value in this row) | 5,600 MT/s |
| PCIe | PCIe 5.0 y 4.0 | PCIe 5.0 |
| Integrated graphics | Intel Graphics | AMD Radeon Graphics |
| Architecture | Arrow Lake | Zen 5 |
| Generation | Core Ultra Series 2 | Ryzen 9000 series |
| Release | January 2025 | August 2024 |
| Unlocked multiplier | No | Yes |
| Performance scores | ||
| gaming score (0-100) | Data not available | Data not available |
| productivity score (0-100) | Data not available | 70 |
| single-core score (0-100) | Data not available | Data not available |
| multi-core score (0-100) | Data not available | Data not available |
| efficiency score (0-100) | Data not available | Data not available |
Still to be verified on the official spec sheet: Core Ultra 9 285 (Base and boost frequencies, Release date (month), Official RAM speed, PCIe version, Maximum temperature (Tjmax), PCIe lanes, Maximum RAM capacity); Ryzen 9 9900X (Release date (month), PCIe version, Memory channels, Maximum power (PPT), Maximum temperature (Tjmax), PCIe lanes, Maximum RAM capacity).
Scores from 0 to 100 calculated from sourced benchmarks. If there is no real data, nothing is shown.
Gaming
Single-core
Multi-core
Productivity
Efficiency
Sources: Blender Open Data.
Relative performance (in Blender 3D rendering, not in games) divided by the current price. It is a figure to interpret, not a verdict.
Core Ultra 9 285
Ryzen 9 9900X
We couldn't find a video of this exact combination. These include one of the products or cover products of a similar tier: they work as a reference, but FPS depends on the GPU, the games and the settings of each test.
Productos de nivel parecido
Channel: Canal por verificar
Watch on YouTube (opens in a new tab)Productos de nivel parecido
Channel: Canal por verificar
Watch on YouTube (opens in a new tab)Productos de nivel parecido
Channel: Canal por verificar
Watch on YouTube (opens in a new tab)Productos de nivel parecido
Channel: Canal por verificar
Watch on YouTube (opens in a new tab)Visual comparison of the official specifications. It does not measure real-world performance.
Cores
Threads
Boost / turbo
L2 + L3 cache
TDP / base power
Relative scale among the selected CPUs (100 = highest value on each axis). These are specifications, not performance.